



Description
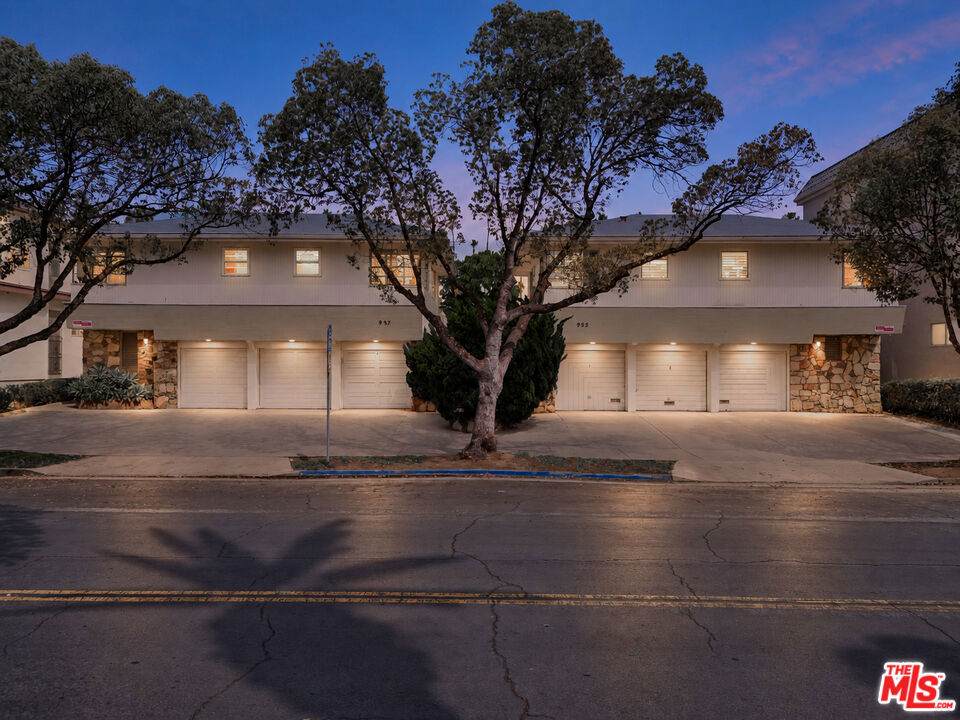
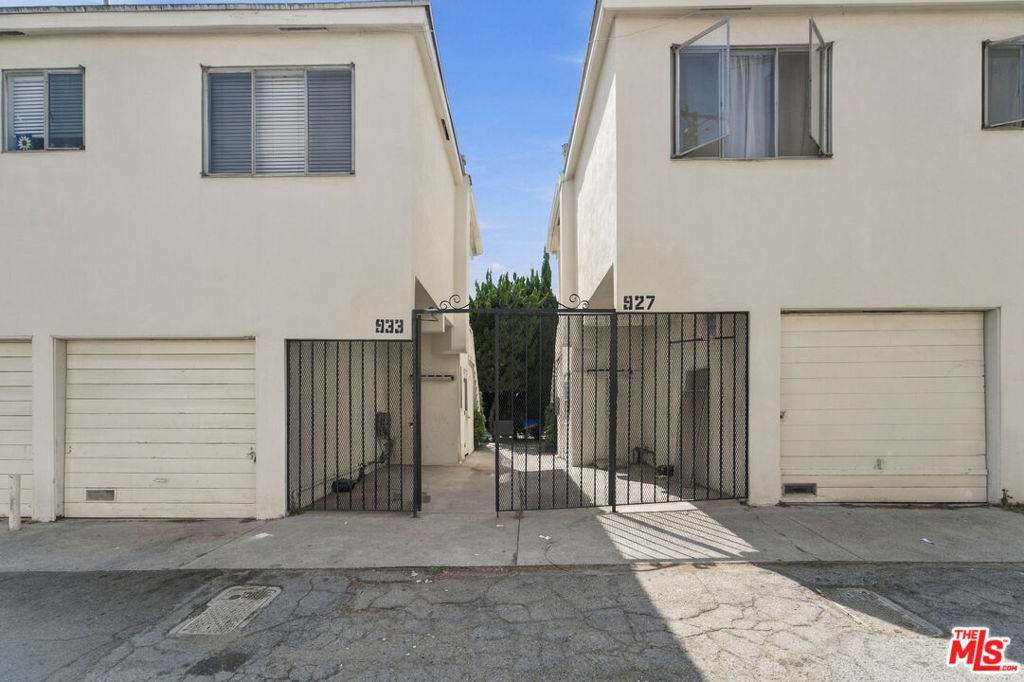
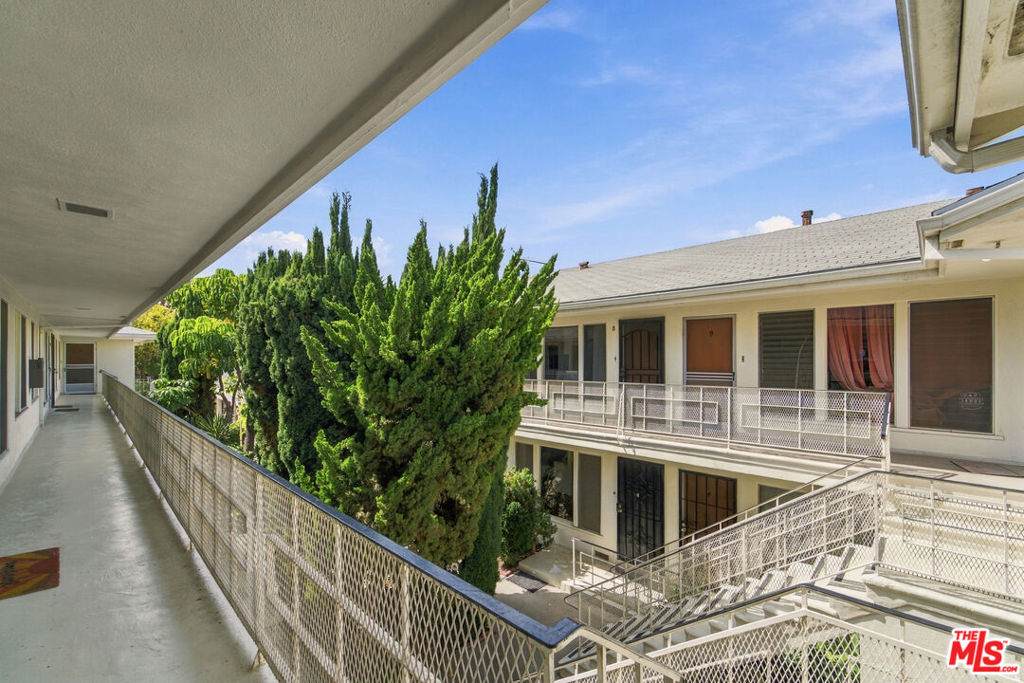
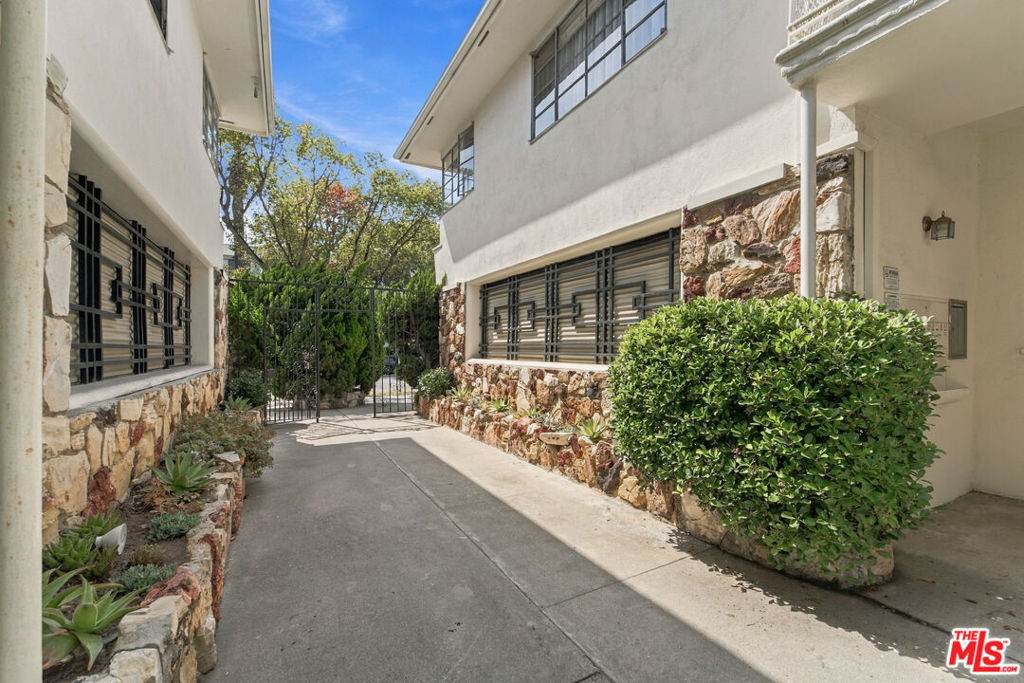
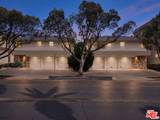
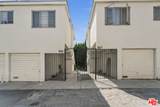
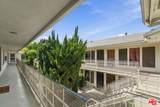
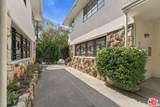
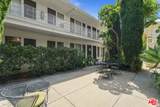
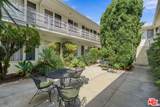
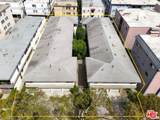
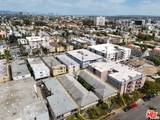
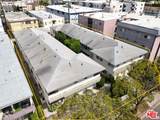
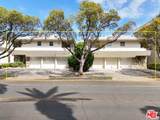
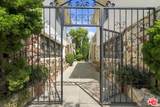
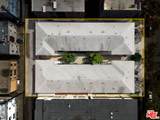
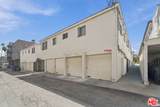
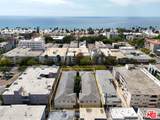
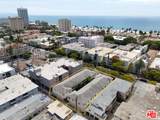
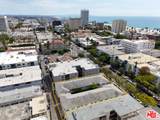
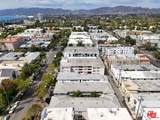
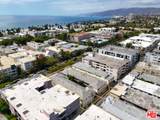
927 & 933 3rd Street is a 20-unit multifamily investment offering assembled across two adjacent parcels in Santa Monica's Wilshire Montana district three blocks from the beach and within a short walk of both Montana Avenue and the Third Street Promenade. The two 1956-vintage buildings are held and operated as a single asset, and are offered together.The unit mix is six two-bedroom units, ten one-bedroom units and four studios across 15,582 net rentable square feet on a combined 14,999 square foot lot.Scale of this kind is unusual in the submarket: of the eight most recent apartment sales in the immediate area, only one exceeded 15 units, and none offered a two-parcel assemblage.The defining characteristic of the offering is the spread between in-place and market rents. Current scheduled income is $464,067 against a projected market of $651,048 a 40.3% gap that translates into 64.3% net operating income growth as units turn. At the list price the asset trades at a 5.21% cap rate on in-place income and 7.69% on stabilized market income, with the difference representing the value a buyer underwrites and pays for.
-
22BEDS
-
0.34ACRES
-
0BATHS
-
01/2 BATHS
-
15,582SQFT
-
$359$/SQFT
School Ratings & Info
Description
927 & 933 3rd Street is a 20-unit multifamily investment offering assembled across two adjacent parcels in Santa Monica's Wilshire Montana district three blocks from the beach and within a short walk of both Montana Avenue and the Third Street Promenade. The two 1956-vintage buildings are held and operated as a single asset, and are offered together.The unit mix is six two-bedroom units, ten one-bedroom units and four studios across 15,582 net rentable square feet on a combined 14,999 square foot lot.Scale of this kind is unusual in the submarket: of the eight most recent apartment sales in the immediate area, only one exceeded 15 units, and none offered a two-parcel assemblage.The defining characteristic of the offering is the spread between in-place and market rents. Current scheduled income is $464,067 against a projected market of $651,048 a 40.3% gap that translates into 64.3% net operating income growth as units turn. At the list price the asset trades at a 5.21% cap rate on in-place income and 7.69% on stabilized market income, with the difference representing the value a buyer underwrites and pays for.
Based on information from California Regional Multiple Listing Service, Inc. as of 2026-11-16T10:25:46.757. This information is for your personal, non-commercial use and may not be used for any purpose other than to identify prospective properties you may be interested in purchasing. Display of MLS data is deemed reliable but is not guaranteed accurate by the MLS or eXp Realty of California Inc.. Licensed in the State of California, USA.